Statistical Programming and Visualization
A 3-day workshop that introduce students to the science of statistical programming and rich visualization techniques. We will take a learn-by-building approach, with each participant developing sets after sets of statistical plots and graphic under the guidance of our lead instructor and his band of teaching assistants.
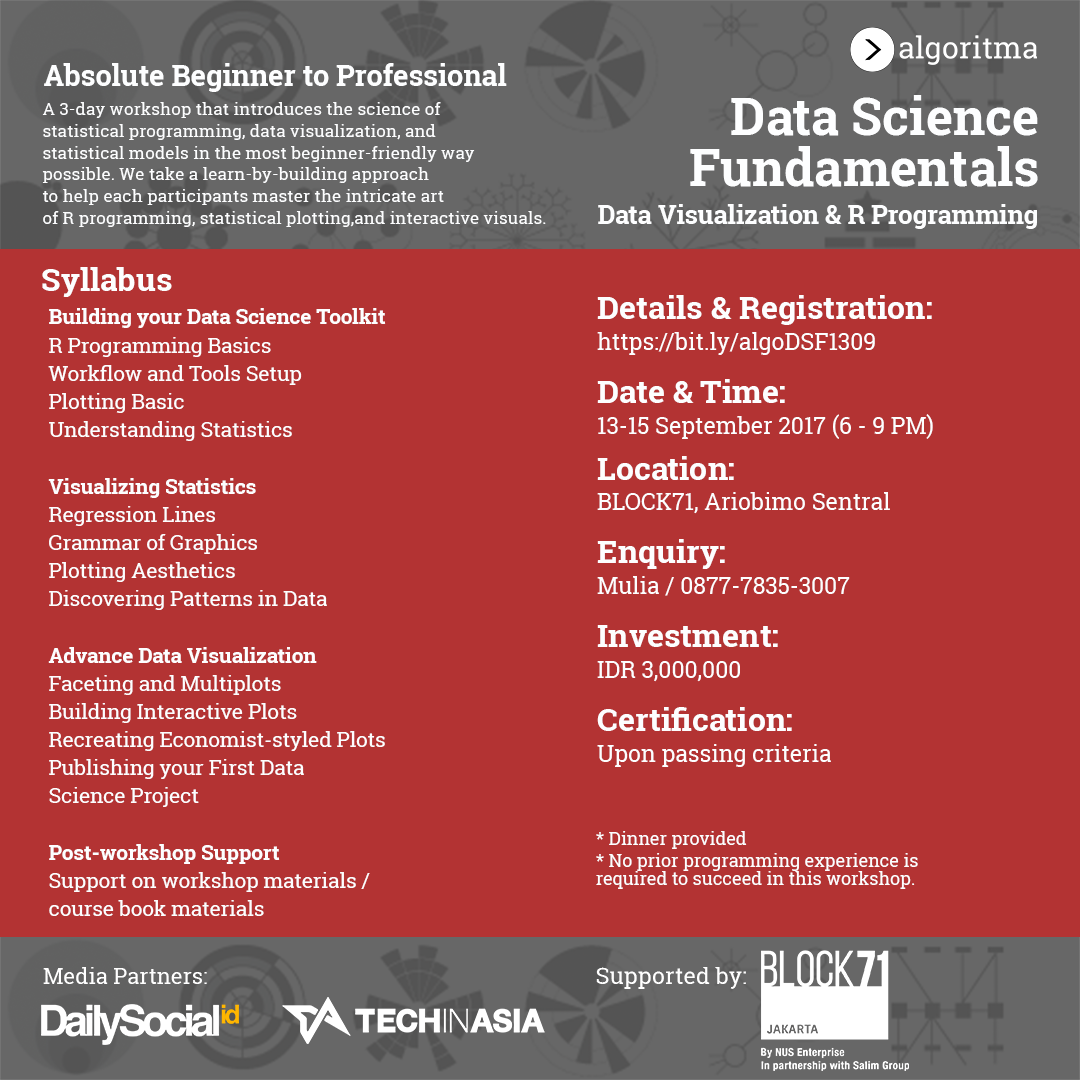
Absolute Beginner to Complete Professional
New to statistics or have no experience in programming ? You'll still be able to follow along the workshop with relative ease. The workshops is conducted by our lead instructor and students will be assisted throughout by a band of qualified teaching assistants. As we take a learn - by building approach to developing data science skills, participants are required to write code and build their data science project : certificates awarded for successful completion only.
3 Days Course Details :
13th Sept (18:00 - 21:00)
1. Data Science Explained
2. R Programming Basics
3. Statistics Fundamental
14th Sept (18:00 - 21:00)
1. Plotting in R
2. Grammar of Graphics
3. Advanced Styling
4. Building Our Own Themes
15th Sept (18:00 - 21:00)
1. Data Visualization in Practice
2. Interactive Plotting
3. Recreating Economist Plots
4. Combining Plot Elements with Regression line and confidence intervals.
For futher information & Special rate : CLICK HERE